node text
In [1]:
import matplotlib as mpl
from matplotlib import pyplot as plt

import requests
from io import StringIO as sio

import baltic as bt

address='https://raw.githubusercontent.com/evogytis/fluB/master/data/mcc%20trees/InfB_NPt_ALLs1.mcc.tre' ## address of example tree
fetch_tree = requests.get(address) ## fetch tree
treeFile=sio(fetch_tree.text) ## stream from repo copy

ll=bt.loadNexus(treeFile,tip_regex='_([0-9\-]+)$') ## treeFile here can alternatively be a path to a local file
ll.treeStats() ## report stats about tree

fig,ax = plt.subplots(figsize=(10,80),facecolor='w')

x_attr=lambda k: k.absoluteTime

ll.plotTree(ax,x_attr=x_attr,colour='k') ## tree
ll.plotPoints(ax,x_attr=x_attr,size=20,colour='w',zorder=100) ## tips

target_func=lambda k: k.is_leaf() ## which branches will be annotated
text_func=lambda k: '_'.join(k.name.split('_')[:-1]) ## what text is plotted
text_x_attr=lambda k: k.absoluteTime+0.2 ## where x coordinate for text is
kwargs={'va':'center','ha':'left','size': 8} ## kwargs for text

ll.addText(ax,x_attr=text_x_attr,target=target_func,text=text_func,**kwargs) ## text will use a different x attribute function to shift it to the right

ax.set_ylim(-1,ll.ySpan+1)

ax.set_yticks([])
ax.set_yticklabels([])
[ax.spines[loc].set_visible(False) for loc in ax.spines if loc not in ['bottom']]
plt.show()
Tree height: 29.430115
Tree length: 451.887106
strictly bifurcating tree
annotations present

Numbers of objects in tree: 903 (451 nodes and 452 leaves)
In [2]:
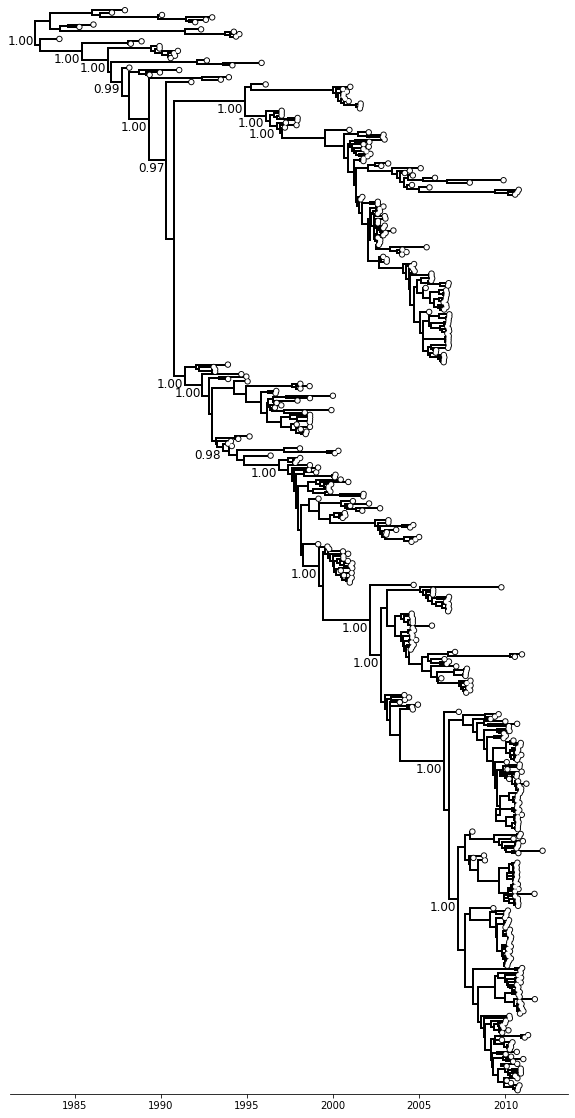
fig,ax = plt.subplots(figsize=(10,20),facecolor='w')

x_attr=lambda k: k.absoluteTime

ll.plotTree(ax,x_attr=x_attr,colour='k') ## tree
ll.plotPoints(ax,x_attr=x_attr,size=20,colour='w',zorder=100) ## tips

text_x_attr=lambda k: k.absoluteTime-0.1 ## shift text back
text_y_attr=lambda k: k.y-0.5 ## shift text down
target_func=lambda k: k.is_node() and k.traits['posterior']>=0.95 and len(k.leaves)>100 ## annotate nodes with posterior >0.95 and >100 descendant tips
text_func=lambda k: '%.2f'%(k.traits['posterior']) ## what text is plotted
kwargs={'va':'top','ha':'right','size': 12} ## kwargs for text

ll.addText(ax,x_attr=text_x_attr,y_attr=text_y_attr,target=target_func,text=text_func,**kwargs)

ax.set_ylim(-1,ll.ySpan+1)

ax.set_yticks([])
ax.set_yticklabels([])
[ax.spines[loc].set_visible(False) for loc in ax.spines if loc not in ['bottom']]
plt.show()
In [ ]: