import baltic as bt
from baltic import bt_utils

import matplotlib as mpl
from matplotlib import pyplot as plt
from matplotlib.gridspec import GridSpec

mpl.use("Agg")

fig = plt.figure(figsize=(5,5),facecolor='w')
gs = GridSpec(1,1)

ax = plt.subplot(gs[0])

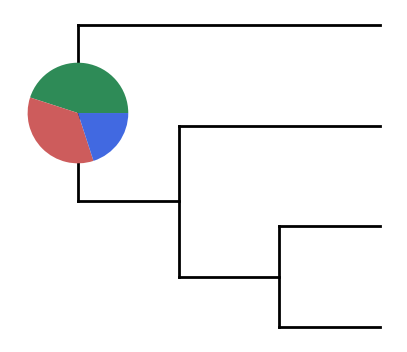
state_set = ["Lithuania", "Latvia", "Estonia"]
state_probs = [0.45, 0.35, 0.2]

treestring = '((("A":1,"B":1):1,"C":2):1,"D":3);'
ll = bt.make_tree(treestring, 'divergence')
ll.root.traits = {'location.states.set': state_set, 'location.states.set.prob': state_probs}
ll.treeStats()

state_colours = {'Lithuania': 'seagreen', 'Latvia': 'indianred', 'Estonia': 'royalblue', 'other': 'lightgray'}

ll.plot_tree(ax)
bt_utils.plot_node_piechart(ax = ax, node = ll.root, traitName = 'location.states', traitColourDict = state_colours, other_thres = 0.005)

bt_utils.clean_axes(ax)
plt.savefig('basic-tree-piechart.png', bbox_inches='tight')