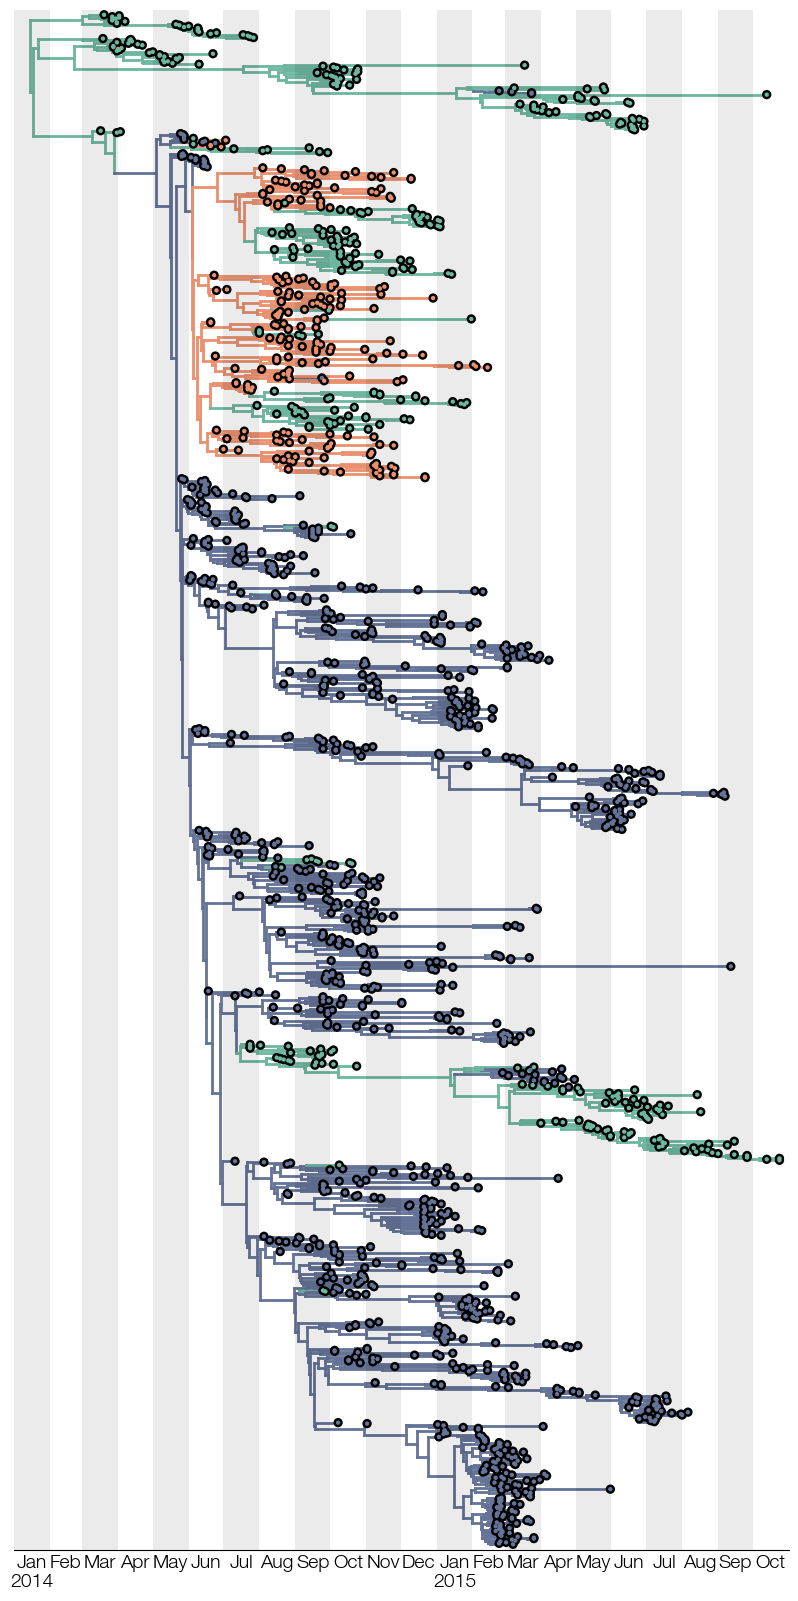
import baltic as bt
from baltic import bt_utils

import matplotlib as mpl
from matplotlib import pyplot as plt
from matplotlib.gridspec import GridSpec

mpl.use("Agg")

ll = bt.io.load_nexus('Makona_1610_cds_ig.GLM.MCC.tree', 'time')
ll.treeStats() ## report stats about tree

admin2country = {
'Bo': 'SLE', 'Bombali': 'SLE', 'Bonthe': 'SLE', 'Kailahun': 'SLE', 'Kambia': 'SLE', 'Kenema': 'SLE', 'Koinadugu': 'SLE', 'Kono': 'SLE', 'Moyamba': 'SLE', 'PortLoko': 'SLE', 'Pujehun': 'SLE', 'Tonkolili': 'SLE', 'WesternRural': 'SLE', 'WesternUrban': 'SLE',
'Bomi': 'LBR', 'Bong': 'LBR', 'Gbarpolu': 'LBR', 'GrandBassa': 'LBR', 'GrandCapeMount': 'LBR', 'GrandGedeh': 'LBR', 'GrandKru': 'LBR', 'Lofa': 'LBR', 'Margibi': 'LBR', 'Maryland': 'LBR', 'Montserrado': 'LBR', 'Nimba': 'LBR', 'RiverCess': 'LBR', 'RiverGee': 'LBR', 'Sinoe': 'LBR',
'Beyla': 'GIN', 'Boffa': 'GIN', 'Boke': 'GIN', 'Conakry': 'GIN', 'Coyah': 'GIN', 'Dabola': 'GIN', 'Dalaba': 'GIN', 'Dinguiraye': 'GIN', 'Dubreka': 'GIN', 'Faranah': 'GIN', 'Forecariah': 'GIN', 'Fria': 'GIN', 'Gaoual': 'GIN', 'Gueckedou': 'GIN', 'Kankan': 'GIN', 'Kerouane': 'GIN', 'Kindia': 'GIN', 'Kissidougou': 'GIN', 'Koubia': 'GIN', 'Koundara': 'GIN', 'Kouroussa': 'GIN', 'Labe': 'GIN', 'Lelouma': 'GIN', 'Lola': 'GIN', 'Macenta': 'GIN', 'Mali': 'GIN', 'Mamou': 'GIN', 'Mandiana': 'GIN', 'Nzerekore': 'GIN', 'Pita': 'GIN', 'Siguiri': 'GIN', 'Telimele': 'GIN', 'Tougue': 'GIN', 'Yamou': 'GIN',
'Kedougou': 'SEN', 'Salemata': 'SEN', 'Saraya': 'SEN', 'Velingara': 'SEN', 'Tambacounda': 'SEN',
'Kenieba': 'MLI', 'Kita': 'MLI', 'Kangaba': 'MLI', 'Kati': 'MLI', 'Yanfolila': 'MLI',
'Gabu': 'GNB', 'Tombali': 'GNB',
'SanPedro': 'CIV', 'Folon': 'CIV', 'Kabadougou': 'CIV', 'Cavally': 'CIV', 'Tonkpi': 'CIV', 'Bafing': 'CIV'
} ## this dict translates location names in the tree to the corresponding country

traitName = 'location.states' ## key used to access annotation of interest in tree

colours = {'SLE': '#647397', 'GIN': '#6db69f', 'LBR': '#ea906e'}
colourFxn = lambda k: colours[admin2country[k.traits[traitName]]]

fig = plt.figure(figsize=(10, 20), facecolor='w')
gs = GridSpec(1, 1)

ax = plt.subplot(gs[0])

ll.plot_tree(ax, colourFxn=colourFxn)
ll.plot_points(ax, colourFxn=colourFxn, pointSize=10)

calendarTimeline = bt_utils.generate_calendar_timeline('2014-01-01', '2015-11-01')
bt_utils.format_time_grid(ax, calendarTimeline)
bt_utils.plot_time_grid(ax, calendarTimeline)

ax.tick_params(labelsize=14)

bt_utils.clean_axes(ax, hideSpines=['left', 'top', 'right'], removeTickLabels='y')

ax.set_xlim(bt_utils.calendar_to_decimal_date('2014-01-01'), bt_utils.calendar_to_decimal_date('2015-11-01'))
ax.set_ylim(-5, ll.ySpan + 5)

plt.savefig('simple-tree.png', bbox_inches='tight')