import baltic as bt
from baltic import bt_utils
from baltic import curonia

import matplotlib as mpl
from matplotlib import pyplot as plt
from matplotlib.gridspec import GridSpec

# import numpy as np

mpl.use("Agg")
#########

segments = ['PB1', 'PB2', 'PA', 'HA', 'NP', 'NA', 'MP', 'NS']
trees = {}

for seg in segments:
    ll, meta = bt.io.load_JSON(f"avian-flu_h5n1_{seg.lower()}_2y.json", 'divergence') ## this import from URL also works

    ll.sort_branches()
    trees[seg] = ll

    ll.treeStats()

print(len(trees))

####### this does plotting

fig = plt.figure(figsize=(30, 15), facecolor='w')
gs = GridSpec(1, 1)

ax = plt.subplot(gs[0])
#########

treeOrder = [trees[seg] for seg in segments]
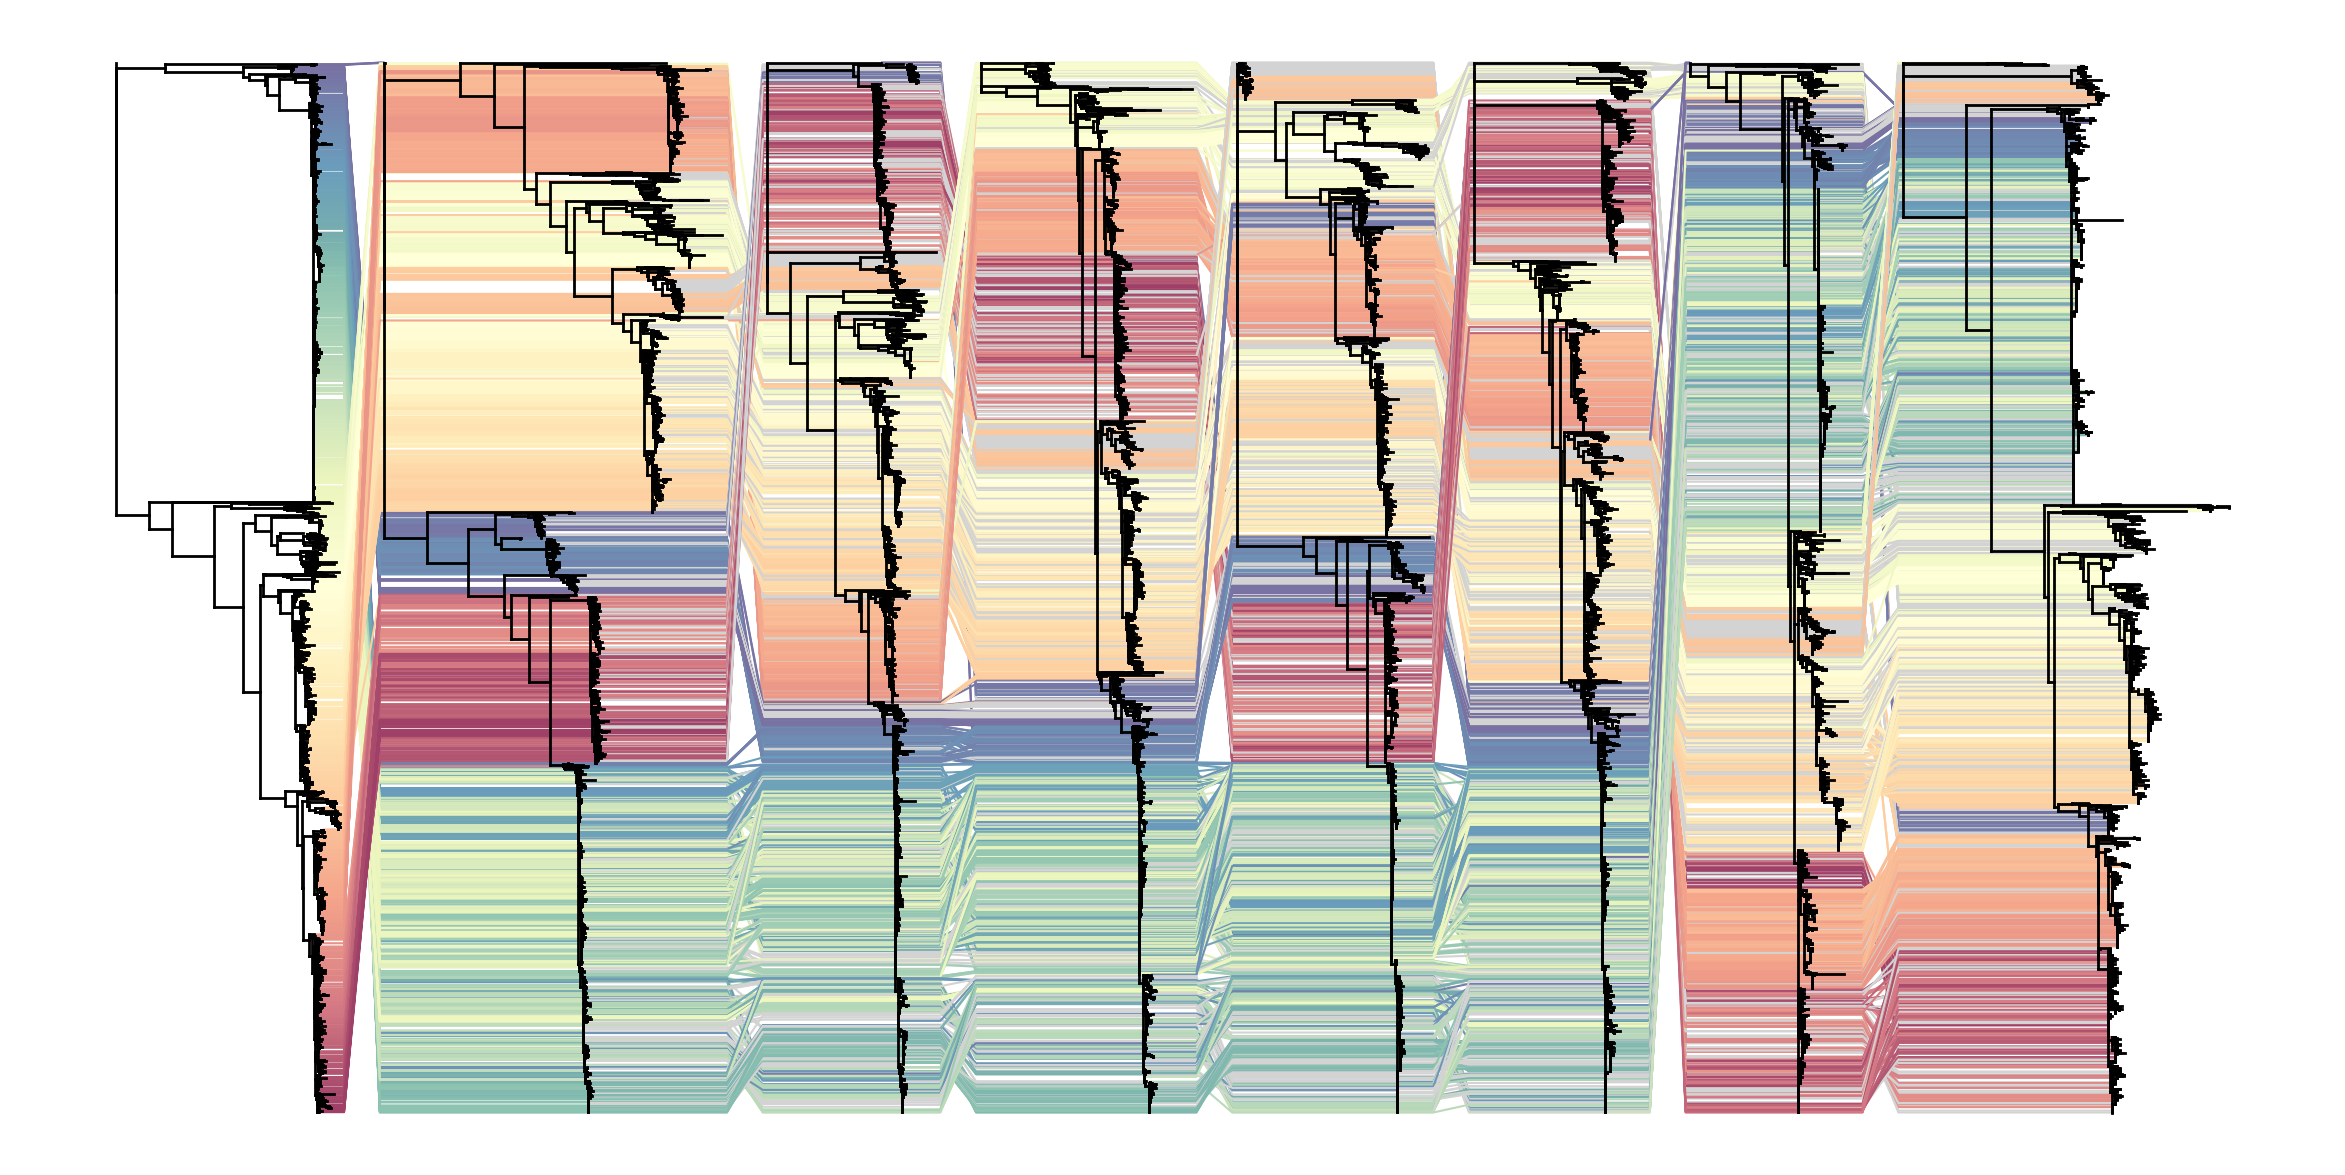
curonia.plot_tangled_chain(ax=ax, treeList=treeOrder)

bt_utils.clean_axes(ax)
plt.savefig('nextstrain-avian-flu-tanglegram.png', bbox_inches='tight')