import baltic as bt
from baltic import bt_utils

import matplotlib as mpl
from matplotlib import pyplot as plt
from matplotlib.gridspec import GridSpec

mpl.use("Agg")
#########

ll = bt.io.load_newick('MERS-CoV.85.CFM.labelled_tree.newick', 'divergence') ## treeFile here can alternatively be a path to a local file
ll.treeStats() ## report stats about tree

####### this does plotting
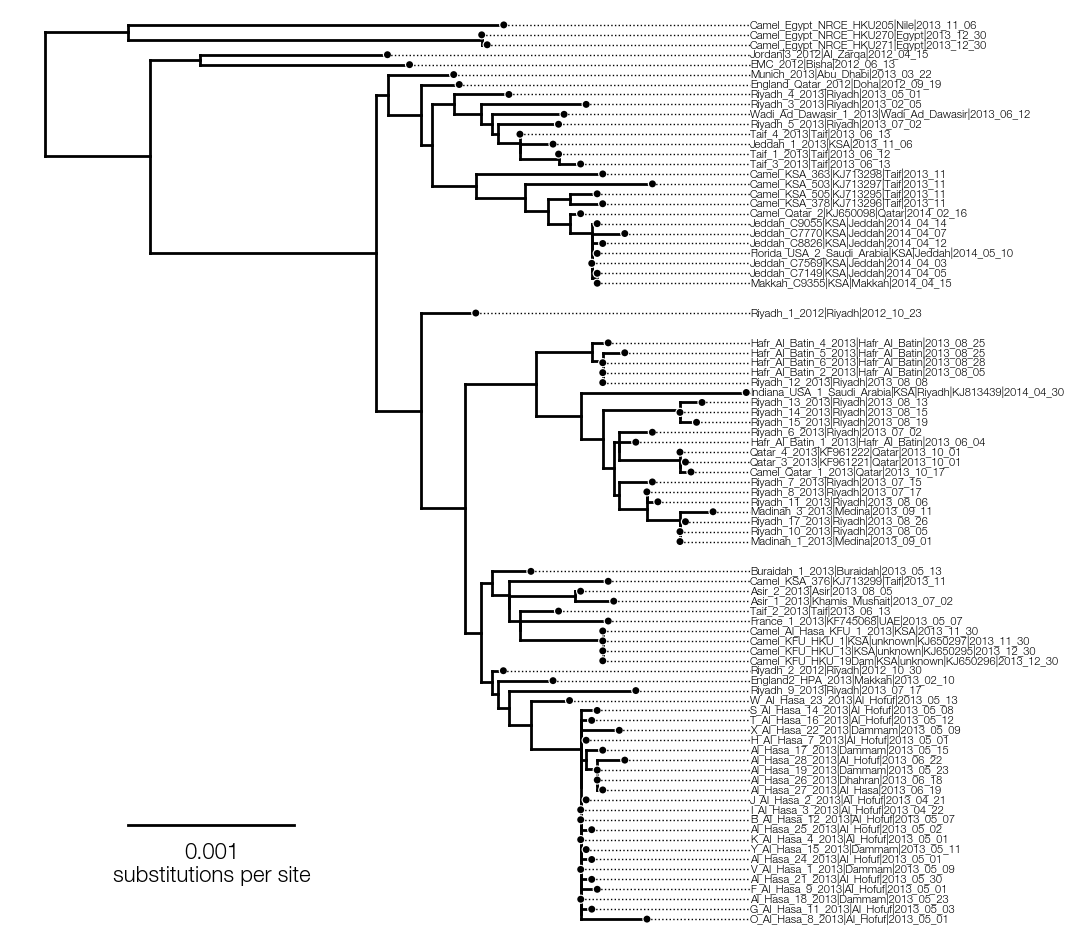
fig = plt.figure(figsize=(10, 12), facecolor='w')
gs = GridSpec(1, 1)

ax = plt.subplot(gs[0])

alHasa_ca = ll.find_MRCA(ll.get_external(lambda k: 'Al_Hasa' in k.name)) ## get common ancestor of all Al Hasa tips
Riyadh_1 = ll.get_leaf('Riyadh_1_2012__Riyadh__2012_10_23') ## fetch this sequence

padNodes = {alHasa_ca: 2, Riyadh_1: 2} ## provide padding space around Al Hasa node and Riyadh sequence

ll.sort_branches()
ll.plot_tree(ax, padNodes=padNodes) ## note that padNodes is now provided to all plotting functions - tree, points and text
ll.plot_points(ax, padNodes=padNodes, pointSize=25, colour='k', outlineColour='w', outlineSize=45)
ll.plot_aligned_tip_labels(ax=ax, padNodes=padNodes, textContentFxn=lambda k: k.name.replace('__','|'), fontsize=8)

#####
bt_utils.plot_scale_bar(ax=ax, xy=(0.0005, 10), tree=ll, textKwargs={'size': 16}, unitText='substitutions per site')

bt_utils.clean_axes(ax=ax)

ax.tick_params(axis='x', labelsize=22)

ax.set_ylim(-1, ll.ySpan + 1)
plt.savefig('pad-nodes.png', bbox_inches='tight')