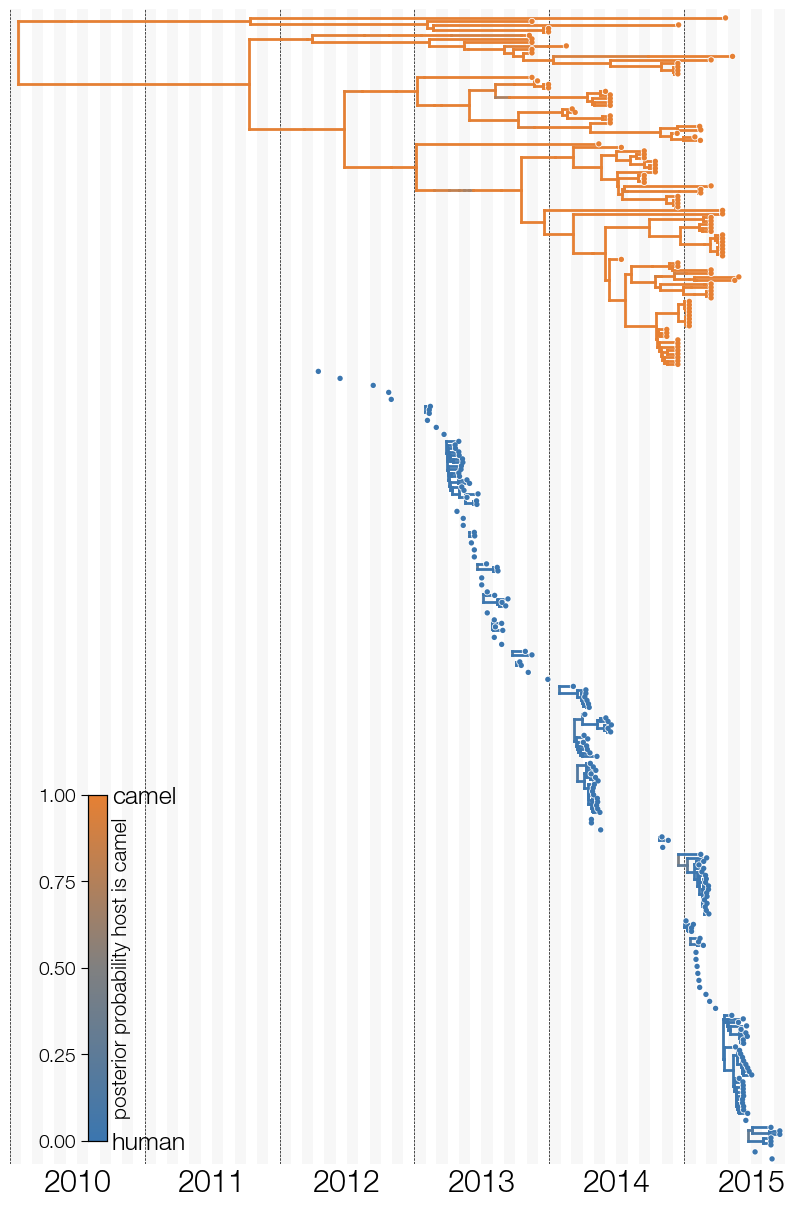
import baltic as bt
from baltic import bt_utils

import matplotlib as mpl
from matplotlib import pyplot as plt
from matplotlib.gridspec import GridSpec

import numpy as np

mpl.use("Agg")

ll = bt.io.load_nexus('MERS.mcc.tree', 'time') ## treeFile here can alternatively be a path to a local file
ll.treeStats() ## report stats about tree

####### split tree into continuous periods of evolution
traitName = 'type'

countrySubtrees = ll.explode_tree(trait=traitName, stem=False)

print(len(countrySubtrees))

####### this does plotting

fig = plt.figure(figsize=(10, 15), facecolor='w')
gs = GridSpec(1, 1)

ax = plt.subplot(gs[0])

sortedSubtrees = sorted(countrySubtrees, key = lambda t: (t.root.traits[traitName], t.root.absoluteTime))[::-1] ## sort subtrees by host and root date

yOffset = 0

host_cmap = bt_utils.make_cmap(['#3B76AF', 'grey', '#E68033']) ## create a colour map
convertStateProbs = lambda k: {key: value for key, value in zip(k.traits[f"{traitName}.set"], k.traits[f"{traitName}.set.prob"])} ## creates {trait: prob} dict for nodes

colourFxn = lambda k: host_cmap(convertStateProbs(k)['c'] if 'c' in convertStateProbs(k) else 0.0) ## processes the trait.set probabilities, gets the colour corresponding to camel probability
# colourFxn = lambda k: host_cmap(bt_utils._process_trait_prob_set(k, traitName)['c'] if 'c' in bt_utils._process_trait_prob_set(k, traitName) else 0.0) ## can also use bt_util function for this

for subtree in sortedSubtrees:
    subtree.sort_branches()
    subtree.plot_tree(ax, yCoordinateFxn=lambda k: k.y + yOffset, colourFxn=colourFxn)
    subtree.plot_points(ax, pointSize=15, yCoordinateFxn=lambda k: k.y + yOffset, colourFxn=colourFxn, outlineColour='w', outlineSize=25)

    yOffset += subtree.ySpan + 1

calendarTimeline = bt_utils.generate_calendar_timeline('2010-01-01', '2015-10-01', spacing='yearly')
bt_utils.format_time_grid(ax, calendarTimeline, outputFmtFxn=lambda d: bt_utils.convert_date_format(d, '%Y-%m-%d', '%Y'))

calendarTimeline = bt_utils.generate_calendar_timeline('2010-01-01', '2015-10-01', spacing='monthly')
bt_utils.plot_time_grid(ax, calendarTimeline, edgeColour='none', alpha=0.03, zorder=0)

bt_utils.clean_axes(ax, removeTickLabels='y')

[ax.axvline(yr, color='k', ls='--', lw=0.5, zorder=0) for yr in range(2010, 2016)] ## add lines for years

ax.set_xlim(bt_utils.calendar_to_decimal_date('2010-01-01'), bt_utils.calendar_to_decimal_date('2015-10-01'))
ax.set_ylim(-1, yOffset + 1)

ax.tick_params(axis='x', labelsize=22)

### colour bar
ax2 = ax.inset_axes([0.1, 0.02, 0.025, 0.3])
mpl.colorbar.ColorbarBase(ax2, cmap=host_cmap, ticks=np.linspace(0.0,1.0,5))
ax2.tick_params(size=5,labelsize=14)
ax2.set_ylabel('posterior probability host is camel', size=15)
ax3 = ax2.twinx()
ax3.set_ylim(0, 1)
ax3.set_yticks([0.0, 1.0])
ax3.set_yticklabels(['human', 'camel'])
ax3.tick_params(size=0, labelsize=18)

plt.savefig('exploded-tree-low-level.png', bbox_inches='tight')