import baltic as bt
from baltic import bt_utils

import matplotlib as mpl
from matplotlib import pyplot as plt
from matplotlib.gridspec import GridSpec

mpl.use("Agg")

from Bio import SeqIO

##############
seqs = {}

for seq in SeqIO.parse('MERS-CoV.85.CFM.ML_sequence.fasta', 'fasta'):
    seqs[seq.id] = str(seq.seq)

print(len(seqs))
###########
with open('MERS-CoV.85.CFM.position_cross_reference.txt') as f: siteCrossReference = list(map(int,f.read().strip().split(',')))

reindex = {}
for alnCol, idx in enumerate(siteCrossReference):
    reindex[idx] = alnCol
############
ll = bt.io.load_newick('MERS-CoV.85.CFM.labelled_tree.newick', 'divergence')
ll.treeStats()
ll.sort_branches(descending=False)
############
for k in ll.Objects:
    if k.is_leaf():
        k.traits['seq'] = seqs[k.name]
    else:
        k.traits['seq'] = seqs[k.traits['label']]

from collections import Counter
from itertools import combinations

allMutations = []

for k in ll.Objects: ## iterate over branches
    curSeq = k.traits['seq']

    if 'seq' not in k.parent.traits: ## at root - assign no mutations
        k.traits['mutations'] = []
        continue

    parSeq = k.parent.traits['seq']

    k.traits['mutations'] = [f"{parSeq[i]}{reindex[i]}{curSeq[i]}" for i in range(len(curSeq)) if parSeq[i] != curSeq[i]] ## assign mutations to branch based on changes between parent and current branch

    allMutations += k.traits['mutations'] ## remember mutations for counting later

mutCounter = Counter(allMutations) ## {mutation: count}
#############

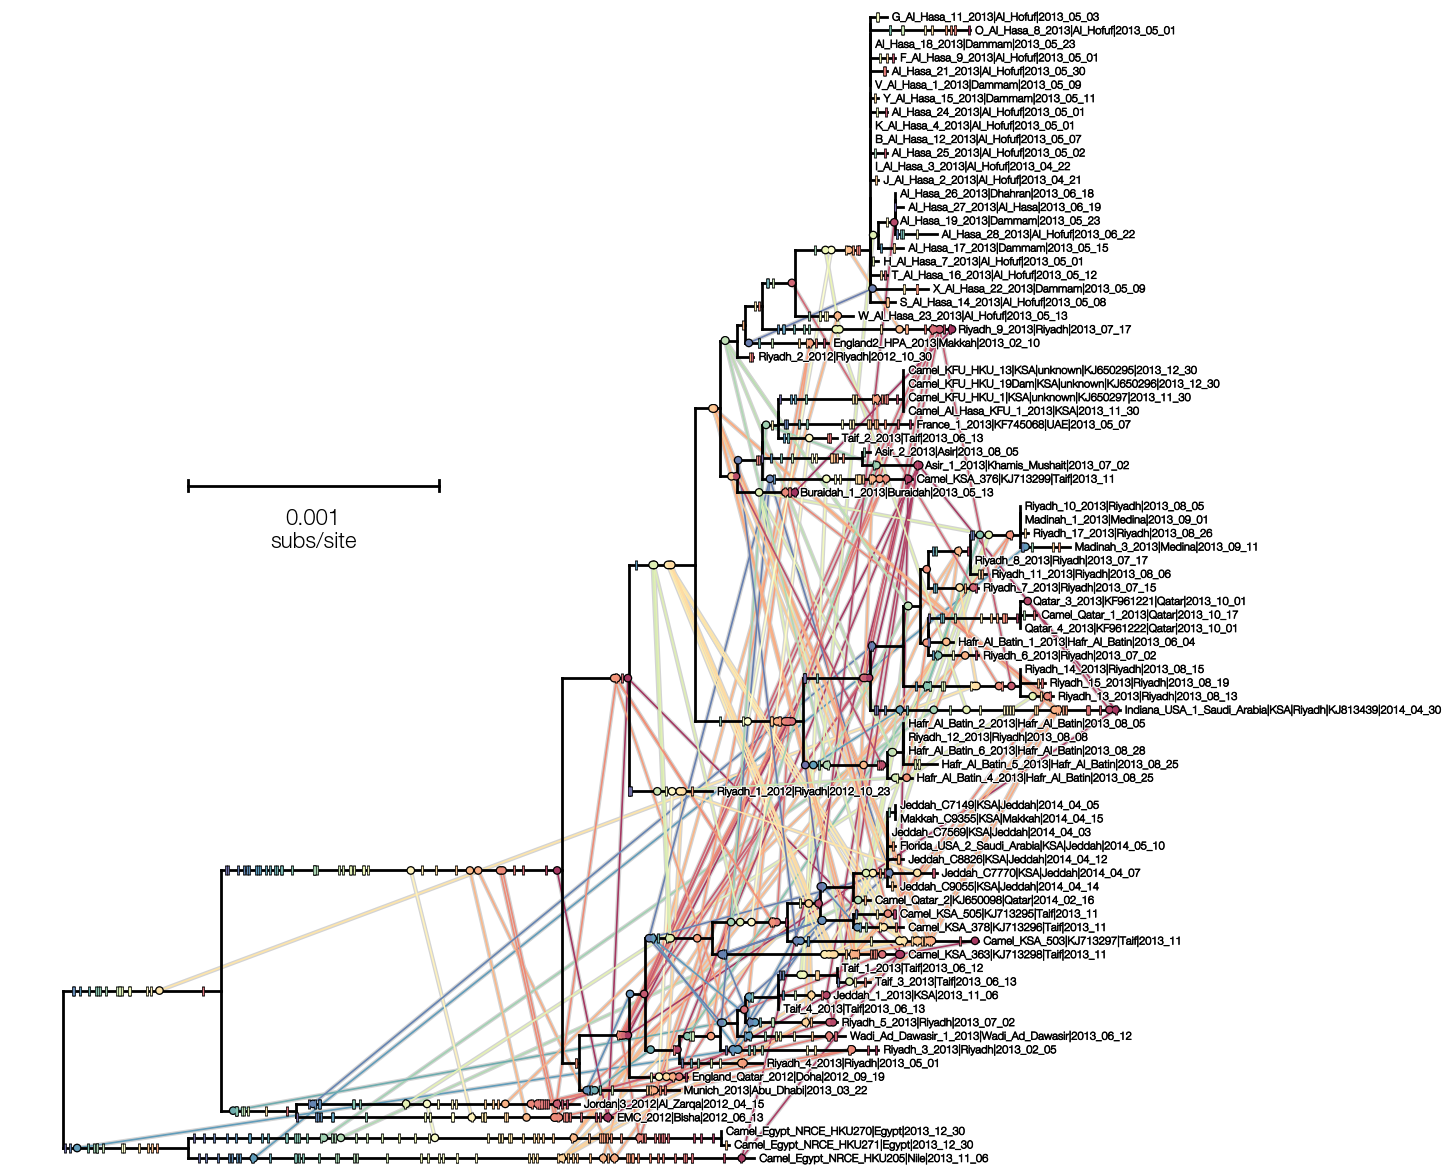
fig = plt.figure(figsize=(15, 15), facecolor='w')
gs = GridSpec(1, 1)
ax = plt.subplot(gs[0])

ll.plot_tree(ax, zorder=2, autoSort=False)

pathEffects = bt_utils.get_path_effects(mainWeight=0.5, outlineWeight=2) ## add text outlines
ll.plot_text(ax, textContentFxn=lambda k: k.name.replace('__', '|'), path_effects=pathEffects, size=8) ## format and add tip names

#############
cmap = bt_utils.desaturate_cmap(mpl.cm.Spectral_r, 0.7)

alnL = 30200 ## genome length

for mutation in mutCounter: ## iterate over mutations
    mutationBranches = ll.get_branches(lambda k: mutation in k.traits['mutations']) ## [branches with mutation]
    assert mutCounter[mutation] == len(mutationBranches), f"Missing branches"

    site = int(mutation[1:-1]) ## extract position
    reverseMutation = f"{mutation[-1]}{site}{mutation[0]}" ## not used

    fracGenome = site/alnL ## compute fraction of site along genome
    fc = cmap(fracGenome) ## get colour

    if mutCounter[mutation] == 1: ## synapomorphy, plotted using '|' marker
        branch = mutationBranches[0]
        x, y = branch.height, branch.y
        x -= branch.length * (1 - fracGenome) ## mutation's x-coordinate is proportional to its position along genome

        ax.scatter(x, y, s=30, marker='|', lw=1, color=fc, zorder=3)
        ax.scatter(x, y, s=50, marker='|', lw=2, color='k', zorder=2)
        continue ## handled synapomorphies, only homoplasies after this

    for branchA, branchB in combinations(mutationBranches, 2): ## iterate over all combinations of branches with homoplasies
        x1, y1 = branchA.height, branchA.y
        x2, y2 = branchB.height, branchB.y

        x1 -= branchA.length * (1 - fracGenome)
        x2 -= branchB.length * (1 - fracGenome)

        ax.plot([x1, x2], [y1, y2], color=fc, ls='-', lw=1.2, zorder=1) ## connect branches with coloured line
        ax.plot([x1, x2], [y1, y2], color='lightgray', ls='-', lw=3, zorder=0)

    for branch in mutationBranches: ## add a circle to homoplasy
        x, y = branch.height, branch.y
        x -= branch.length * (1 - fracGenome)

        ax.scatter(x, y, s=20, fc=fc, ec='none', zorder=3)
        ax.scatter(x, y, s=40, fc='k', ec='none', zorder=2)

bt_utils.clean_axes(ax)
bt_utils.plot_scale_bar(ax, xy=(0.0005, 50), tree=ll, style='fancy', fancyWidth=400, textKwargs={'fontsize': 16})
ax.set_ylim(0, ll.ySpan)

plt.savefig('homoplasy-tree.png', bbox_inches='tight')