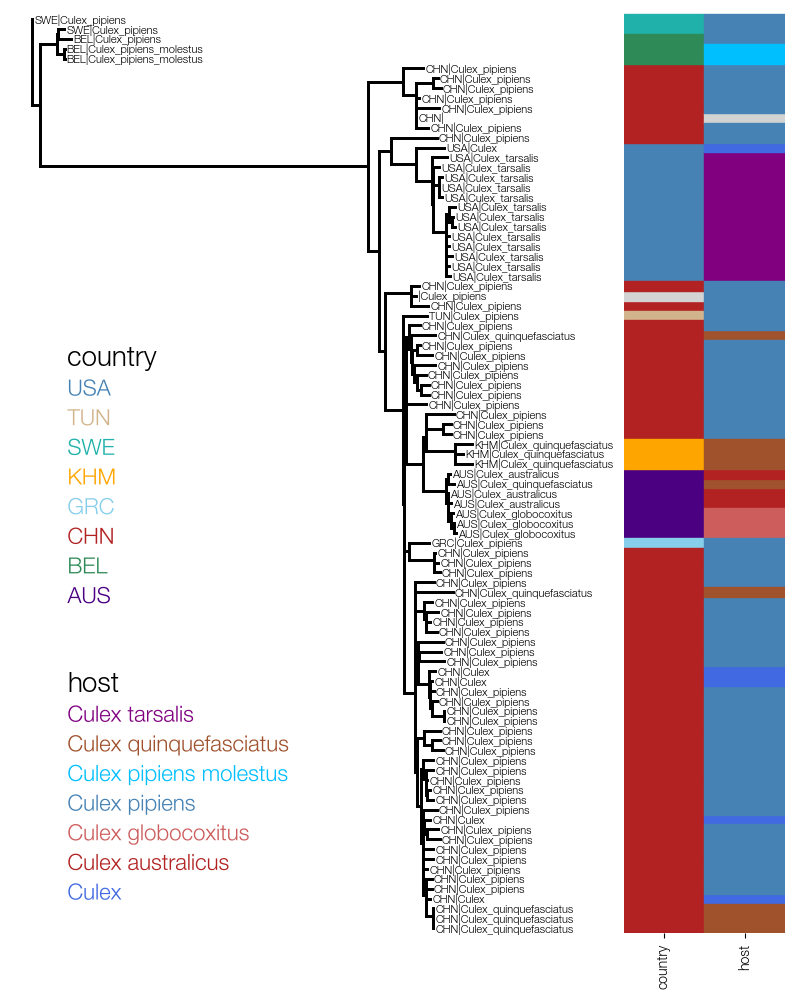
import matplotlib as mpl
from matplotlib import pyplot as plt
from matplotlib.gridspec import GridSpec

import baltic as bt
from baltic import bt_utils
from baltic import curonia

mpl.use("Agg")

fig = plt.figure(figsize=(10, 12), facecolor='w')
gs = GridSpec(1, 2, width_ratios=[3, 1], wspace=0.4)
ax = plt.subplot(gs[0])
ax2 = plt.subplot(gs[1])

## plot tree
countryColours = {'BEL': 'seagreen', '': 'lightgray', 'USA': 'steelblue', 'AUS': 'indigo', 'SWE': 'lightseagreen', 'TUN': 'tan', 'KHM': 'orange', 'GRC': 'skyblue', 'CHN': 'firebrick'}
hostColours = {'': 'lightgray', 'Culex_pipiens': 'steelblue', 'Culex_quinquefasciatus': 'sienna', 'Culex_pipiens_molestus': 'deepskyblue', 'Culex_globocoxitus': 'indianred', 'Culex_tarsalis': 'purple', 'Culex_australicus': 'firebrick', 'Culex': 'royalblue'}

ll = bt.io.load_newick('PB1-wmv6-93.treefile', 'divergence', absoluteTime=True)

ll.root_by_regression() ## root tree
ll.sort_branches(descending=True)
ll.plot_tree(ax, autoSort=False, zorder=10) ## plot tree
ll.plot_text(ax, textContentFxn=lambda k: f"{k.name.split('|')[2]}|{k.name.split('|')[1]}", size=8)
########

labelDict = {'host': {}, 'country': {}}
for k in ll.get_external():
    strain, host, country, loc, coords, date = k.name.split('|')

    labelDict['host'][k.name] = host
    labelDict['country'][k.name] = country

curonia.plot_tree_matrix(treeAx=ax, matrixAx=ax2, tree=ll, labelDict=labelDict, colourDict={'country': countryColours, 'host': hostColours})
#############

for i, host in enumerate(sorted(hostColours)):
    c = hostColours[host]

    pathEffects = bt_utils.get_path_effects(mainColour='none')
    ax.text(0.01, i * 3, host.replace('_', ' '), ha='left', va='bottom', color=c, path_effects=pathEffects, size=16)

ax.text(0.01, len(hostColours)*3, 'host', ha='left', va='bottom', size=20)
####

for i, country in enumerate(sorted(countryColours)):
    c = countryColours[country]

    pathEffects = bt_utils.get_path_effects(mainColour='none')
    ax.text(0.01, 30 + i * 3, country, ha='left', va='bottom', color=c, path_effects=pathEffects, size=16)

ax.text(0.01, 30 + len(countryColours)*3, 'country', ha='left', va='bottom', size=20)

###########
bt_utils.clean_axes(ax)
bt_utils.clean_axes(ax2, removeTickLabels='y')

plt.savefig('tree-matrix.png', bbox_inches='tight')