import baltic as bt
from baltic import samogitia
from baltic import bt_utils

import matplotlib as mpl
from matplotlib import pyplot as plt
from matplotlib.gridspec import GridSpec

import csv

mpl.use("Agg")
#############

def custom_posterior_analysis_worker(i, state, treeString, tipRenameDict, maxDate, headerMode = False):
    """
    headerMode determines whether the worker function outputs the result of the analysis defined by this function or a header formatted for the resulting log file.
    args by default are: i, state, treeString, tipRenameDict, maxDate
    i is index of tree in posterior file
    state is the MCMC state number
    treeString is the tree string that gets passed on to this function
    tipRenameDict is the dict that maps tip names expressed as integers to their full names (many BEAST trees will require this renaming)
    maxDate is the date of the most recent tip (for setting absolute times if need be)

    this function produces identical output to samogitia.tree_length_worker
    """
    from baltic import make_tree

    ll = make_tree(treeString, 'time') ## convert tree string into baltic tree object

    outputLine = [] ## holds parameter(s) to be output

    if headerMode: ## running in header mode - output header(s) for parameter(s) being computed by this function
        outputLine.append('treeLength')
    else: ## running in analysis mode - output parameter(s) for this MCMC state
        outputLine.append(sum(ll.get_parameter_list('length')))

    return i, state, outputLine ## every worker function must output these three parameters for handling their order


treesFile = 'Makona_1610_cds_ig.100.trees' ## input
outputFile = 'Makona_1610_cds_ig.100.treeLength.log.txt' ## output

samogitia.process_posterior_trees(treesPath=treesFile, processFxn=custom_posterior_analysis_worker, outputPath=outputFile, burnin=0) ## use custom function to process posterior

##########
fig = plt.figure(figsize=(10, 5), facecolor='w')
gs = GridSpec(1, 1)

ax = plt.subplot(gs[0])

#### import parameter(s) extracted just now
posterior = []
for l in csv.DictReader(open(outputFile, 'r'), delimiter='\t'):
    posterior.append(float(l['treeLength']))

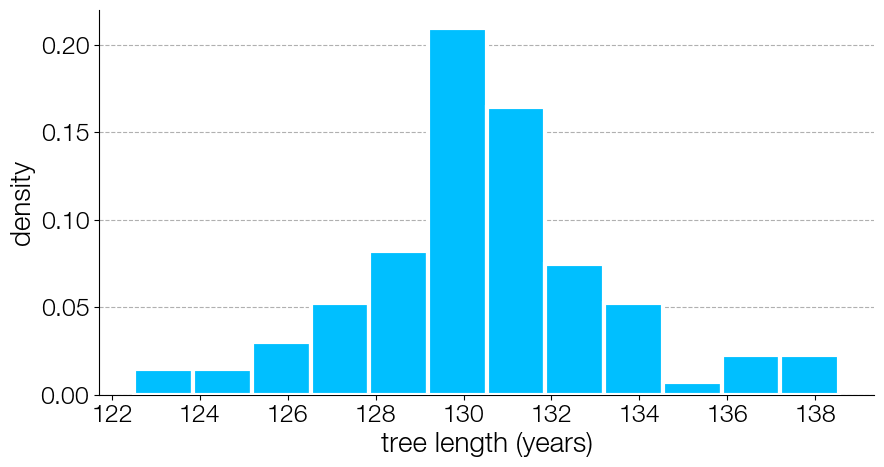
ax.hist(posterior, bins=12, fc='deepskyblue', ec='w', lw=3, density=True, zorder=10) ## plot

# ######### aesthetics
ax.tick_params(labelsize=18)
bt_utils.clean_axes(ax, hideSpines=['top', 'right'], removeTickLabels='none')

ax.set_xlabel('tree length (years)', size=20)
ax.set_ylabel('density', size=20)

ax.grid(axis='y', ls='--', zorder=0)

plt.savefig('samogitia-ebola-custom.png', bbox_inches='tight')