import baltic as bt
from baltic import samogitia
from baltic import bt_utils

import matplotlib as mpl
from matplotlib import pyplot as plt
from matplotlib.gridspec import GridSpec

import csv
import numpy as np

mpl.use("Agg")
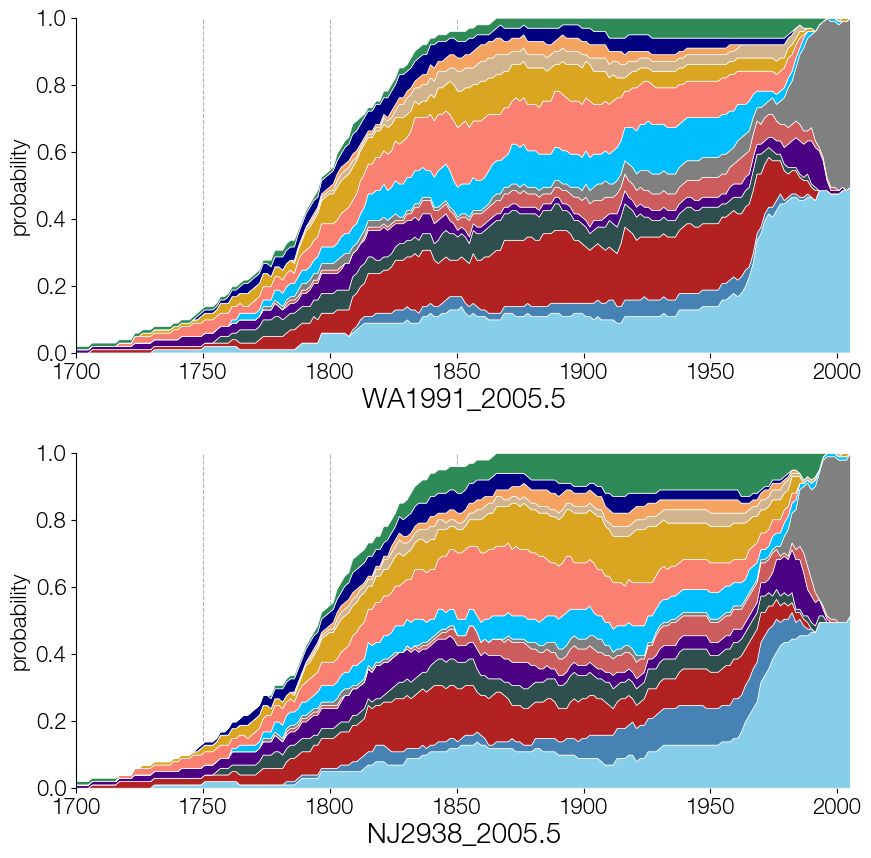
############# extract posterior probabilities of the full lineage of two tips

treesFile = 'batRABV.100.trees' ## input
outputFile = 'batRABV.lineage-trace.log.txt' ## output

traceLineages = ['WA1991_2005.5', 'NJ2938_2005.5'] ## will be tracking the lineage of these two tips
traitName = 'state'
timeline = np.linspace(1700, 2005, 200)

samogitia.process_posterior_trees(treesPath=treesFile, processFxn=samogitia.trace_lineage_trait_worker, outputPath=outputFile, mostRecentDate=2005.5, traitName=traitName, timeline=timeline, tipNames=traceLineages, burnin=0)
############

stateFreqs = {} ## will store counts of each trait state at every time point for every tip
allStates = set() ## stores all unique trait states
mcmcCounter = 0 ## counts how many MCMC states there are

for l in csv.DictReader(open(outputFile, 'r'), delimiter='\t'):
    for entry in l.keys(): ## parse header
        if entry == 'state':
            continue

        tip, timepoint = entry.split('__') ## extract tip and time point

        if tip not in stateFreqs: stateFreqs[tip] = {}
        if timepoint not in stateFreqs[tip]: stateFreqs[tip][timepoint] = {}

        traitState = l[entry] ## get trait state

        if traitState not in stateFreqs[tip][timepoint]: stateFreqs[tip][timepoint][traitState] = 0

        stateFreqs[tip][timepoint][traitState] += 1 ## counting state at this time point for this tip

        allStates.add(traitState)
    mcmcCounter += 1
################

fig = plt.figure(figsize=(10, 10), facecolor='w')
gs = GridSpec(2, 1, hspace=0.3)

colours = {'': 'none', ## this is trait state when nothing exists in the tree
           'Washington': 'skyblue',
           'Idaho': 'deepskyblue',
           'Texas': 'goldenrod',
           'California': 'firebrick',
           'Indiana': 'seagreen',
           'Tennessee': 'indianred',
           'Arizona': 'salmon',
           'Georgia': 'darkslategray',
           'Florida': 'navy',
           'Virginia': 'indigo',
           'NewJersey': 'gray',
           'Michigan': 'steelblue',
           'Iowa': 'tan',
           'Mississippi': 'sandybrown'}

for idx, tip in enumerate(stateFreqs): ## iterate over tips

    ax = plt.subplot(gs[idx]) ## new subplot

    xs = sorted(map(float, stateFreqs[tip].keys())) ## get timepoints, turn to float, sort
    ys = []

    bottom = [0 for _ in xs] ## track bottom of previous trait state

    for traitState in allStates: ## iterate over all possible trait states
        if traitState == '':
            continue ## don't want to count when no branches exist

        fc = colours[traitState] ## grab colour

        traitCounts = []

        for timepoint in sorted(stateFreqs[tip], key=lambda tp: float(tp)): ## iterate over time points for this tip
            if traitState in stateFreqs[tip][timepoint]: ## have a count for this trait state
                traitCounts.append(stateFreqs[tip][timepoint][traitState] / mcmcCounter) ## store number
            else: ## trait state not found for this tip at this time point
                traitCounts.append(0) ## store 0

        ys = traitCounts

        ax.fill_between(xs, bottom, [b + y for b, y in zip(bottom, ys)], fc=fc, ec='w', lw=0.5, zorder=2) ## plot frequency

        for idx, y in enumerate(ys):
            bottom[idx] += y ## adjust bottom

    ##### aesthetics
    ax.set_xlabel(tip, size=20)
    ax.set_ylabel('probability', size=16)

    ax.tick_params(labelsize=16)

    bt_utils.clean_axes(ax, hideSpines=['bottom', 'top', 'right'], removeTickLabels='none')

    ax.grid(axis='x', ls='--', zorder=0)
    ax.set_ylim(0, 1)
    ax.set_xlim(1700, 2005.5)

plt.savefig('samogitia-rabv-trace-state.png', bbox_inches='tight')