import baltic as bt
from baltic import bt_utils
from baltic import curonia

import matplotlib as mpl
from matplotlib import pyplot as plt
from matplotlib.gridspec import GridSpec

mpl.use("Agg")

ll = bt.io.load_newick('zika.nwk', treeType='divergence', tipRegex=r'\|([0-9\-]+)\|[A-Za-z\_]+$', absoluteTime=True, variableDate=True)
ll.treeStats()

ll, uncertainDates = ll.root_by_regression(stat='r^2', forcePositive=True) ## run root-to-tip regression, also returns uncertain tip dates as a dict

##########
fig = plt.figure(figsize=(15, 8), facecolor='w')
gs = GridSpec(1, 1)
ax=plt.subplot(gs[0])

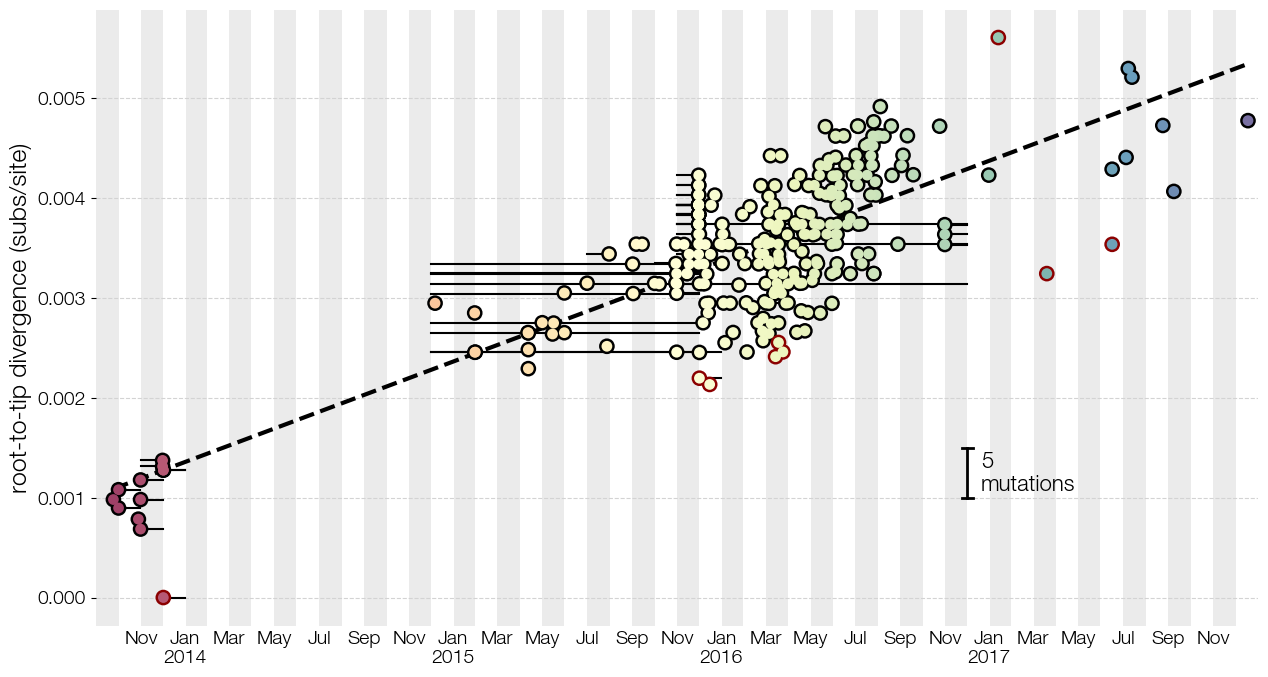
outliers, slope, intercept, residuals = curonia.plot_root_to_tip(ax, ll, highlightOutliers=True, orientation='horizontal') ## plot root to tip

print(f"Number of outliers: {len(outliers)}\nOutliers: {', '.join([k.name for k in outliers])}")

bt.plot_scale_bar(ax, xy=(2017, 0.001), textXY=(2017.05, 0.00125), tree=ll, alnL=10000, style='fancy', fancyWidth=40, orientation='vertical', textKwargs={'fontsize': 16})

calendarTimeline = bt_utils.generate_calendar_timeline('2013-10-01', '2018-02-01', spacing='monthly')
bt_utils.plot_time_grid(ax, calendarTimeline)
bt_utils.format_time_grid(ax, [d for d in calendarTimeline if int(d.split('-')[1]) % 2 == 1])

ax.grid(axis='y', ls='--', color='lightgray')
bt_utils.clean_axes(ax, removeTickLabels='none')

ax.tick_params(labelsize=14)
ax.set_ylabel('root-to-tip divergence (subs/site)', size=18)

ax.set_xlim(bt_utils.calendar_to_decimal_date('2013-10-01'), bt_utils.calendar_to_decimal_date('2018-02-01'))

plt.savefig('root-to-tip.png', bbox_inches='tight')